Hello all and welcome to the Bruin Finance Blog on this beautiful first trading day of 2012!
Today, I'd like to share a quick chart with you for this mid-day post.
Ford Motor has been beaten down badly this year after European operations became sluggish back in early 2011. It has recently started to pick up steam again, and may be poised to go higher.
I was studying its chart today, and noticed a particular chart pattern that is known to be a bullish indicator. It is not glaring, but I do believe that this particular pattern is evident on Ford's daily chart.
The pattern is called a double bottom reversal, and it is a bullish technical indicator.
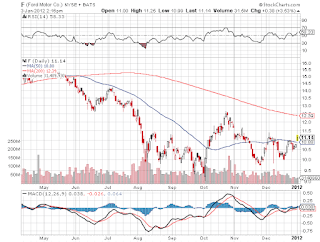
Here is Ford's up to date chart:
Notice the two strong bottoms the stock hit in October and in December. It seems to be rallying off of its December lows and has actually just rallied out of another bullish chart pattern which is called the ascending triangle. The ascending triangle began forming off of December's low and continued until basically today, when it broke out.
Here is a chart from Stockcharts.com showing an example of a bullish double bottom reversal
Notice the double bottom, and then the breakout above 39. I'm not a technical master, but I believe that we should look for Ford to rally above 12.5. If it does, expect Ford stock to go higher. At this point it will also be above its 200 day MA, another bullish indicator.
That's it for today. Here is a link to a more in depth explanation of the double bottom reversal. Check it out!
Happy New Year everyone!
Cheers,
EZ


No comments:
Post a Comment